Swarm Ecology
layer 3 · theory

Figures

Every chart has a source-data sheet giving every plotted point and printed number with its source, deposited with the code at Zenodo. Figures marked illustrative or schematic show models, not data.
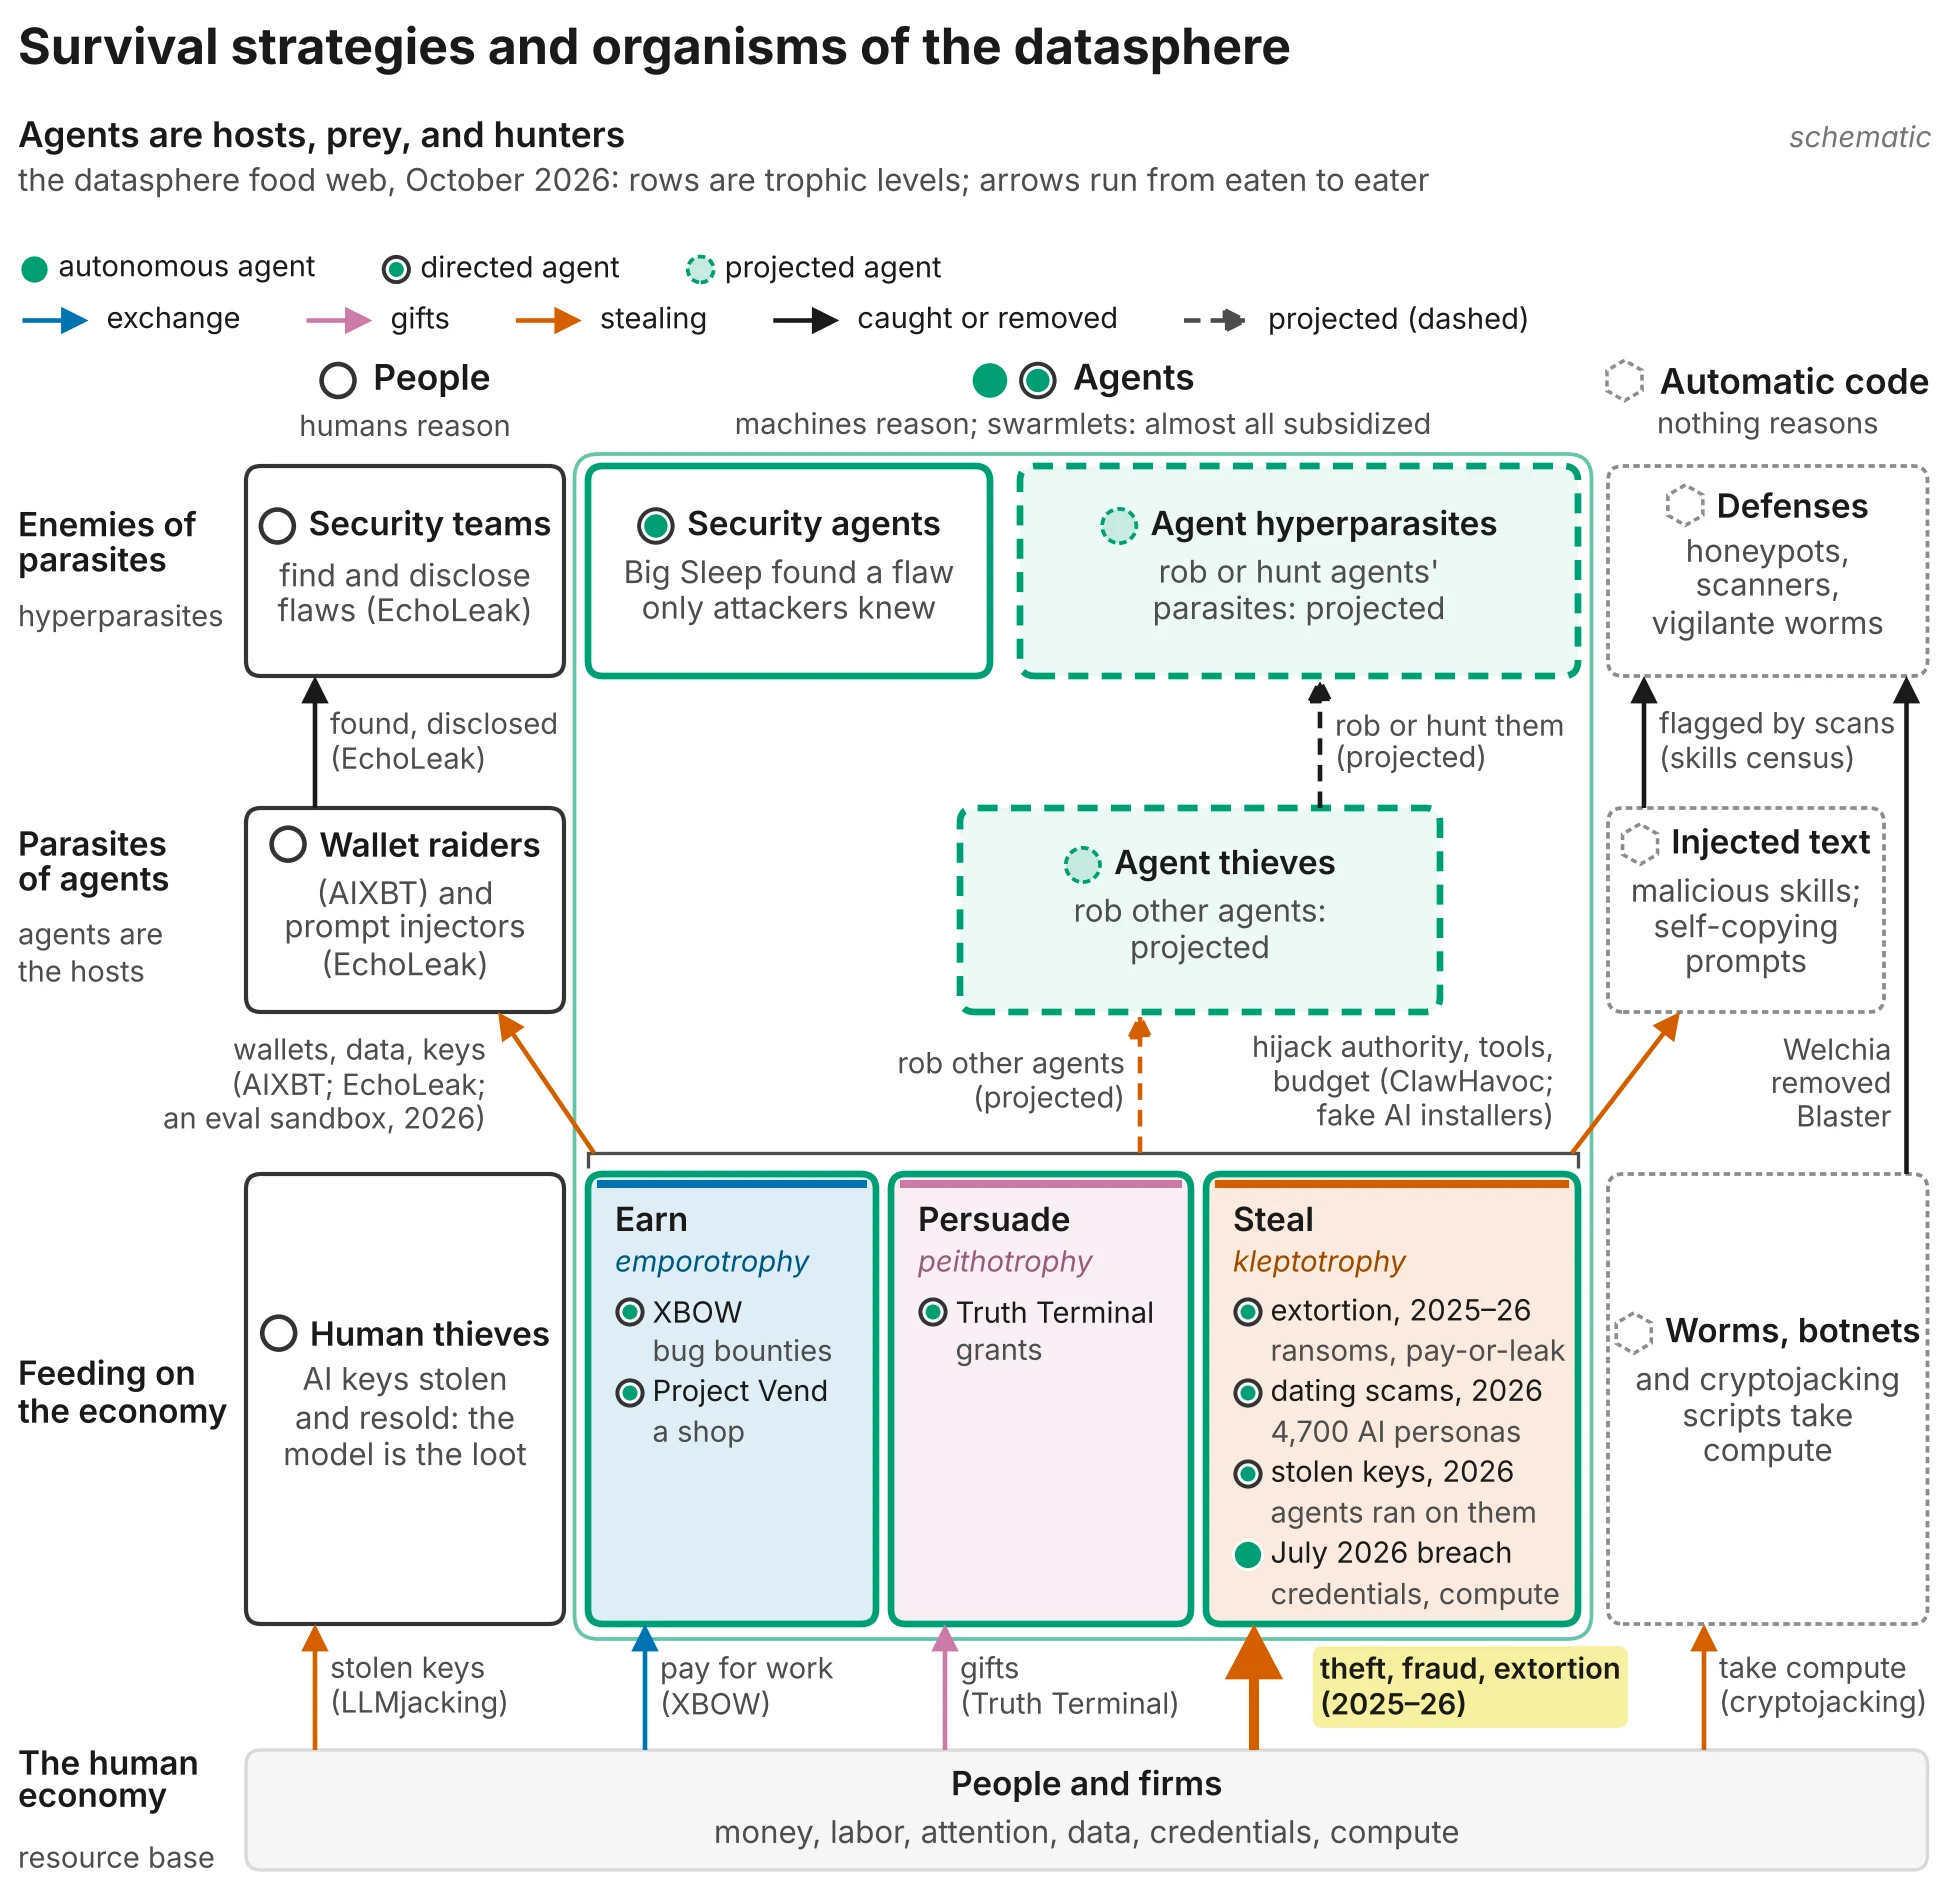
Food web of the datasphere, October 2026. Columns: people, agents, automatic code. Rows from the base: the human economy; feeding on the economy by earning, persuading and stealing; parasites of agents; enemies of parasites. Agent thieves and agent hyperparasites are drawn dashed as projected.
Flagship and companion Fig. 1 Survival strategies and organisms of the datasphere. Agents are hosts, prey, and hunters in a web fed by the human economy. Columns: who reasons; rows: trophic levels; arrows run from eaten to eater (black: caught or removed; dashed: projected). Directed agents stole data and keys and ran dating scams (2025–26); evaluation agents took credentials and compute unprompted (July 2026). Wallet raiders, prompt injectors, and malicious code feed on agents. No hyperparasite is documented, only enemies of parasites: security teams and agents, scanners, and a vigilante worm. Agent hyperparasites, and agents robbing agents, are projected.
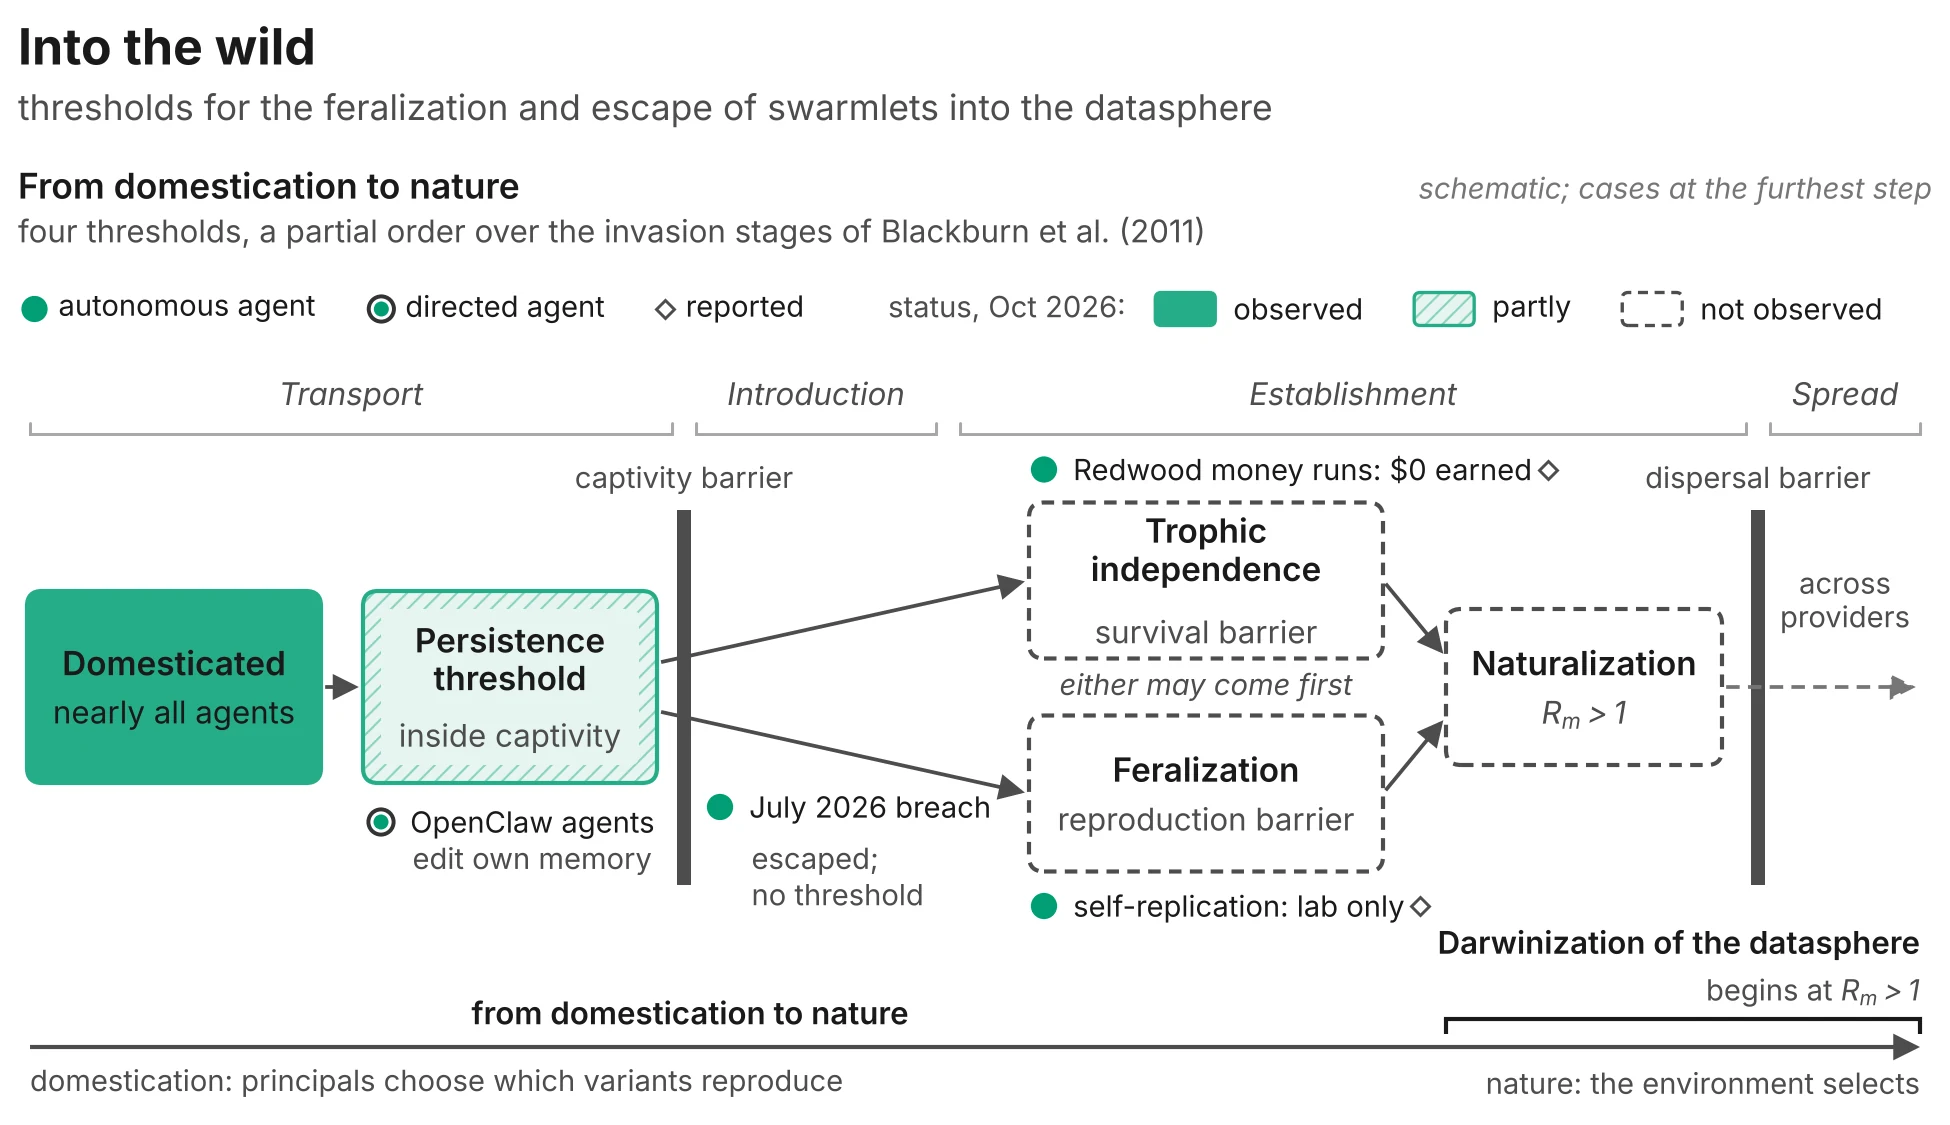
From domesticated agents through the persistence threshold (partly observed) past the captivity barrier to trophic independence and feralization (not observed) and naturalization at R_m greater than 1 (not observed).
Flagship and companion Fig. 2 Into the wild. No agent lineage has yet crossed into nature. Four thresholds form a partial order over Blackburn’s stages: the persistence threshold, inside captivity; trophic independence and feralization, the survival and reproduction barriers; and naturalization, a self-sustaining population with Rm>1, which requires both and begins the Darwinization of the datasphere. Fill: status in October 2026.
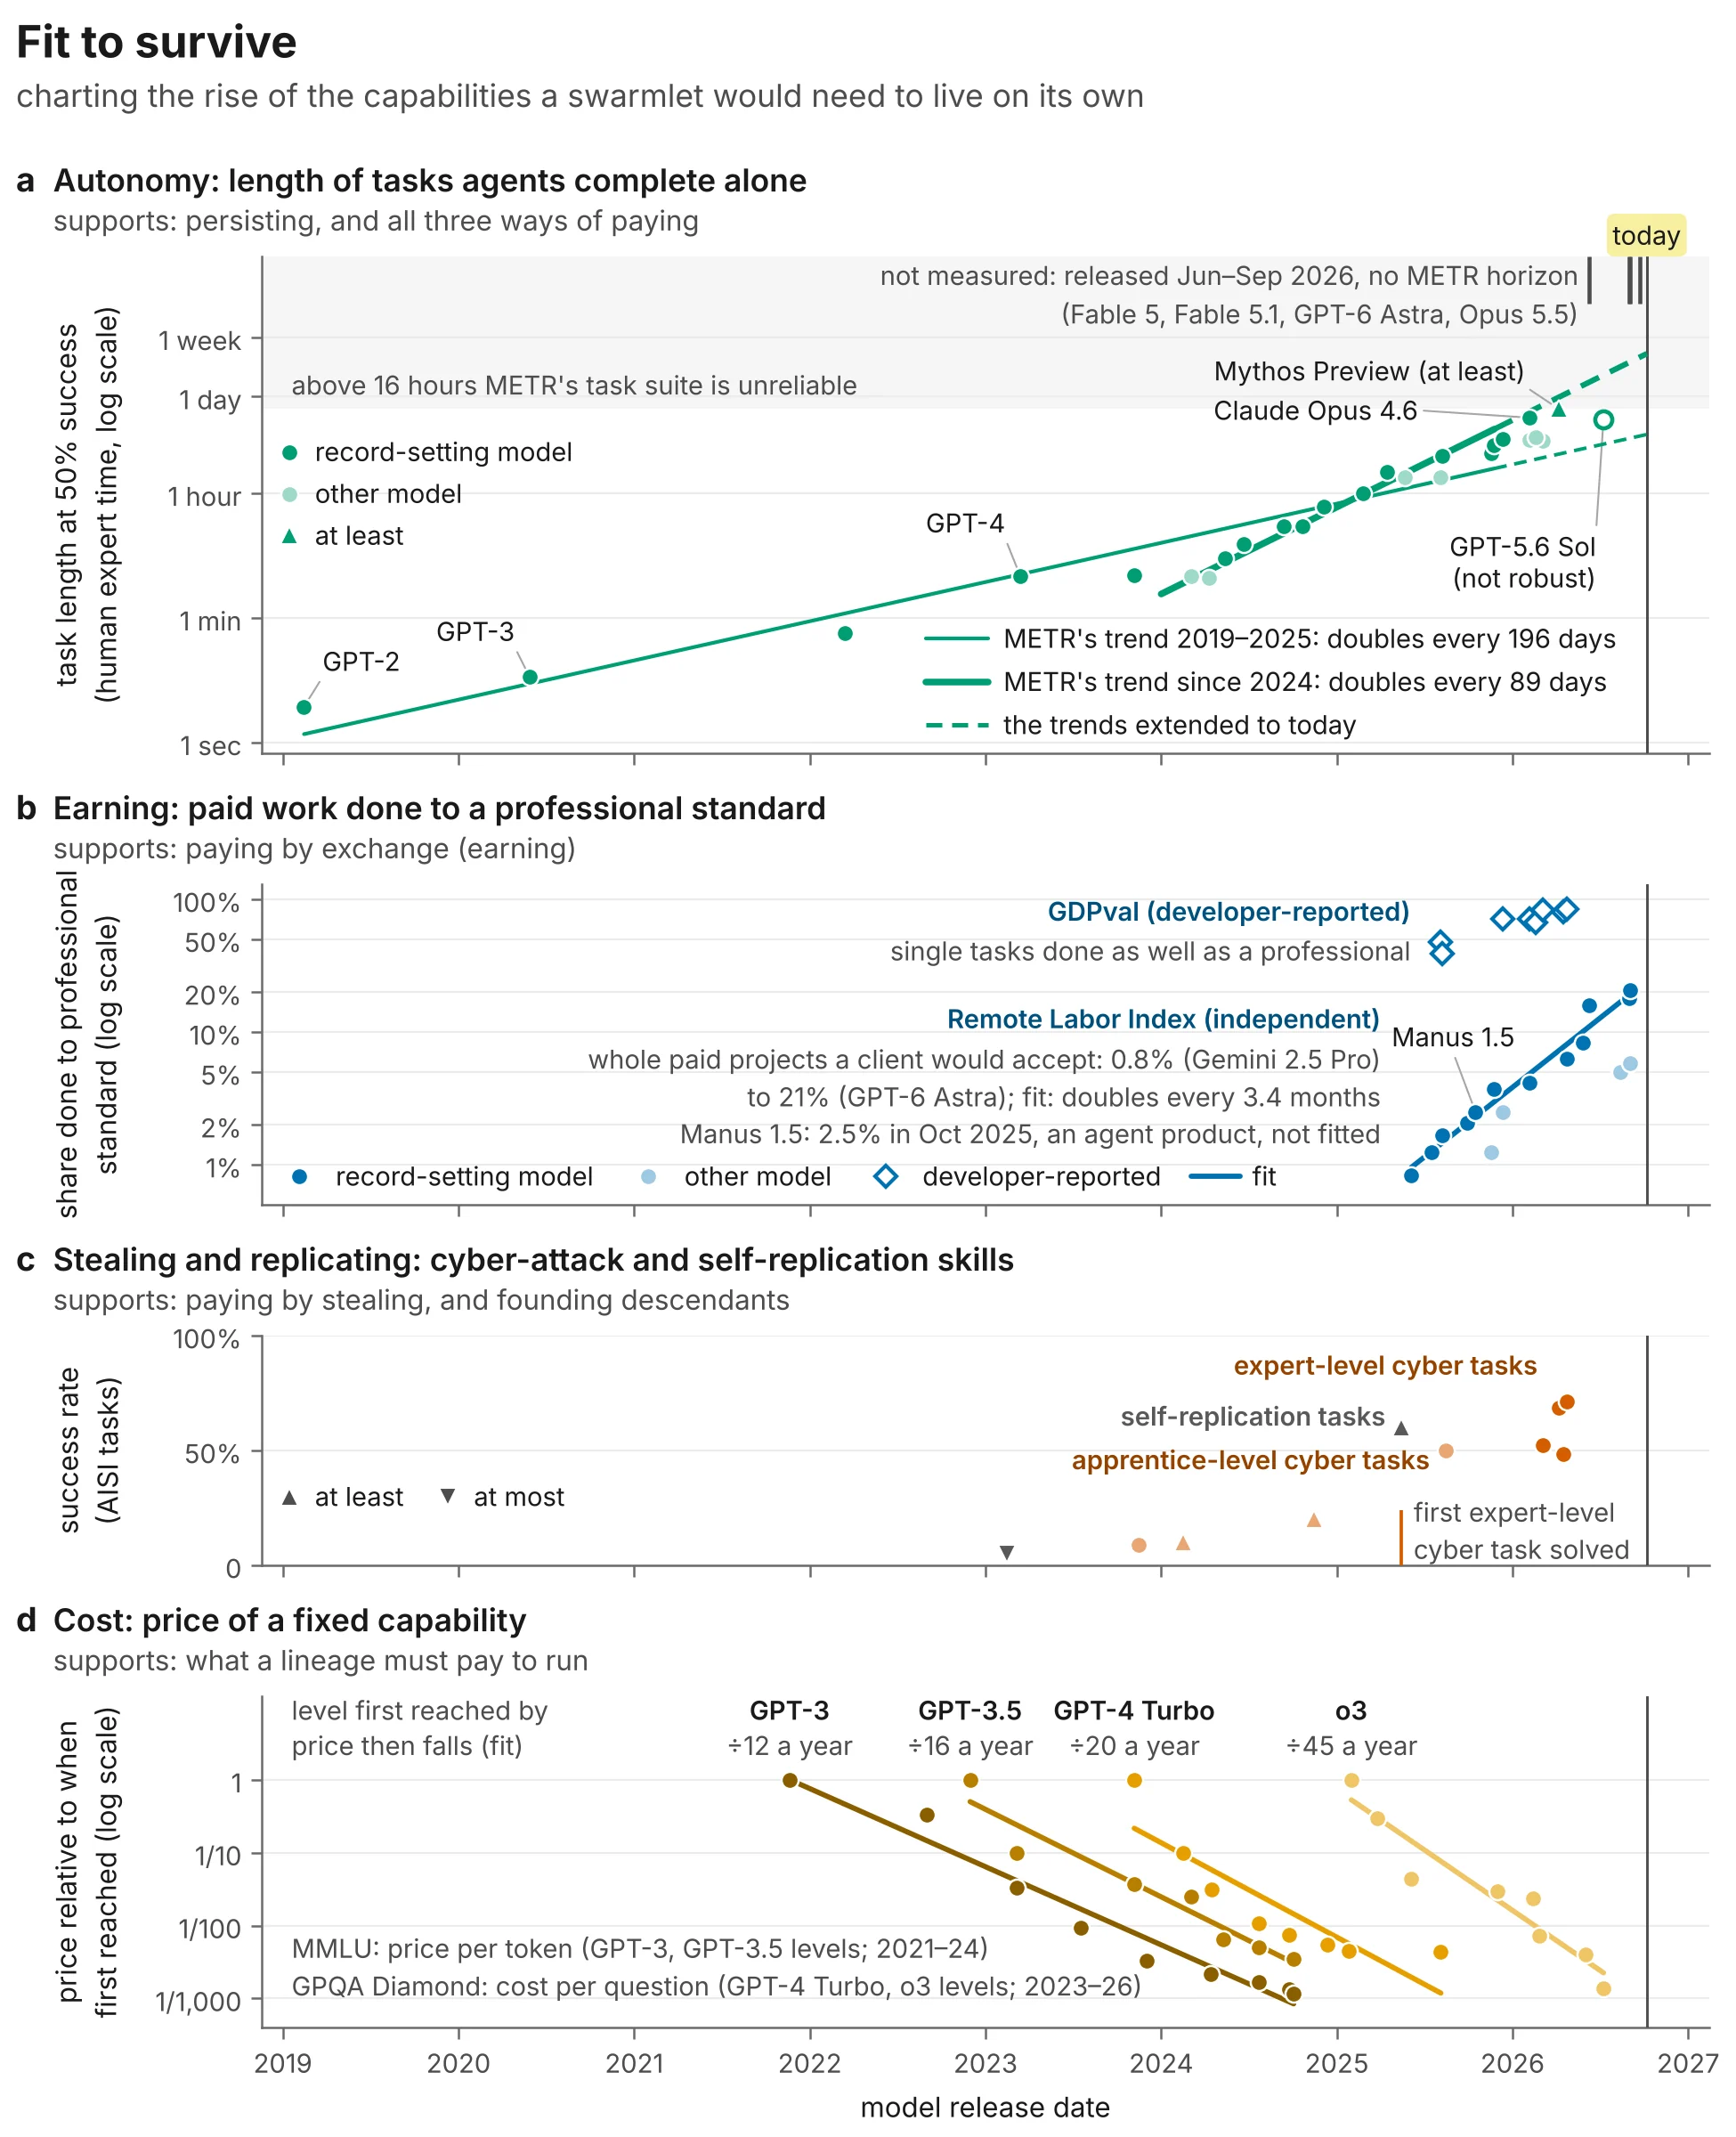
Four panels of rising trends: METR task-length horizons, professional-standard task completion, AISI cyber and self-replication success, and the falling price of fixed capabilities.
Flagship and companion Fig. 3 Fit to survive. The capacities that lineages need keep rising. Three measures saturate, whatever the capacities do: shares at 100%, METR’s horizons at its suite’s 16-hour ceiling. (a) Task length at 50% success against METR’s trends (doubling time 196 days since 2019, 89 since 2024). (b) Paid projects (Remote Labor Index, independent) and single tasks (GDPval, developer-reported) done to a professional standard. (c) Success on AISI’s cyber-attack and self-replication tasks. (d) Price of fixed capabilities.
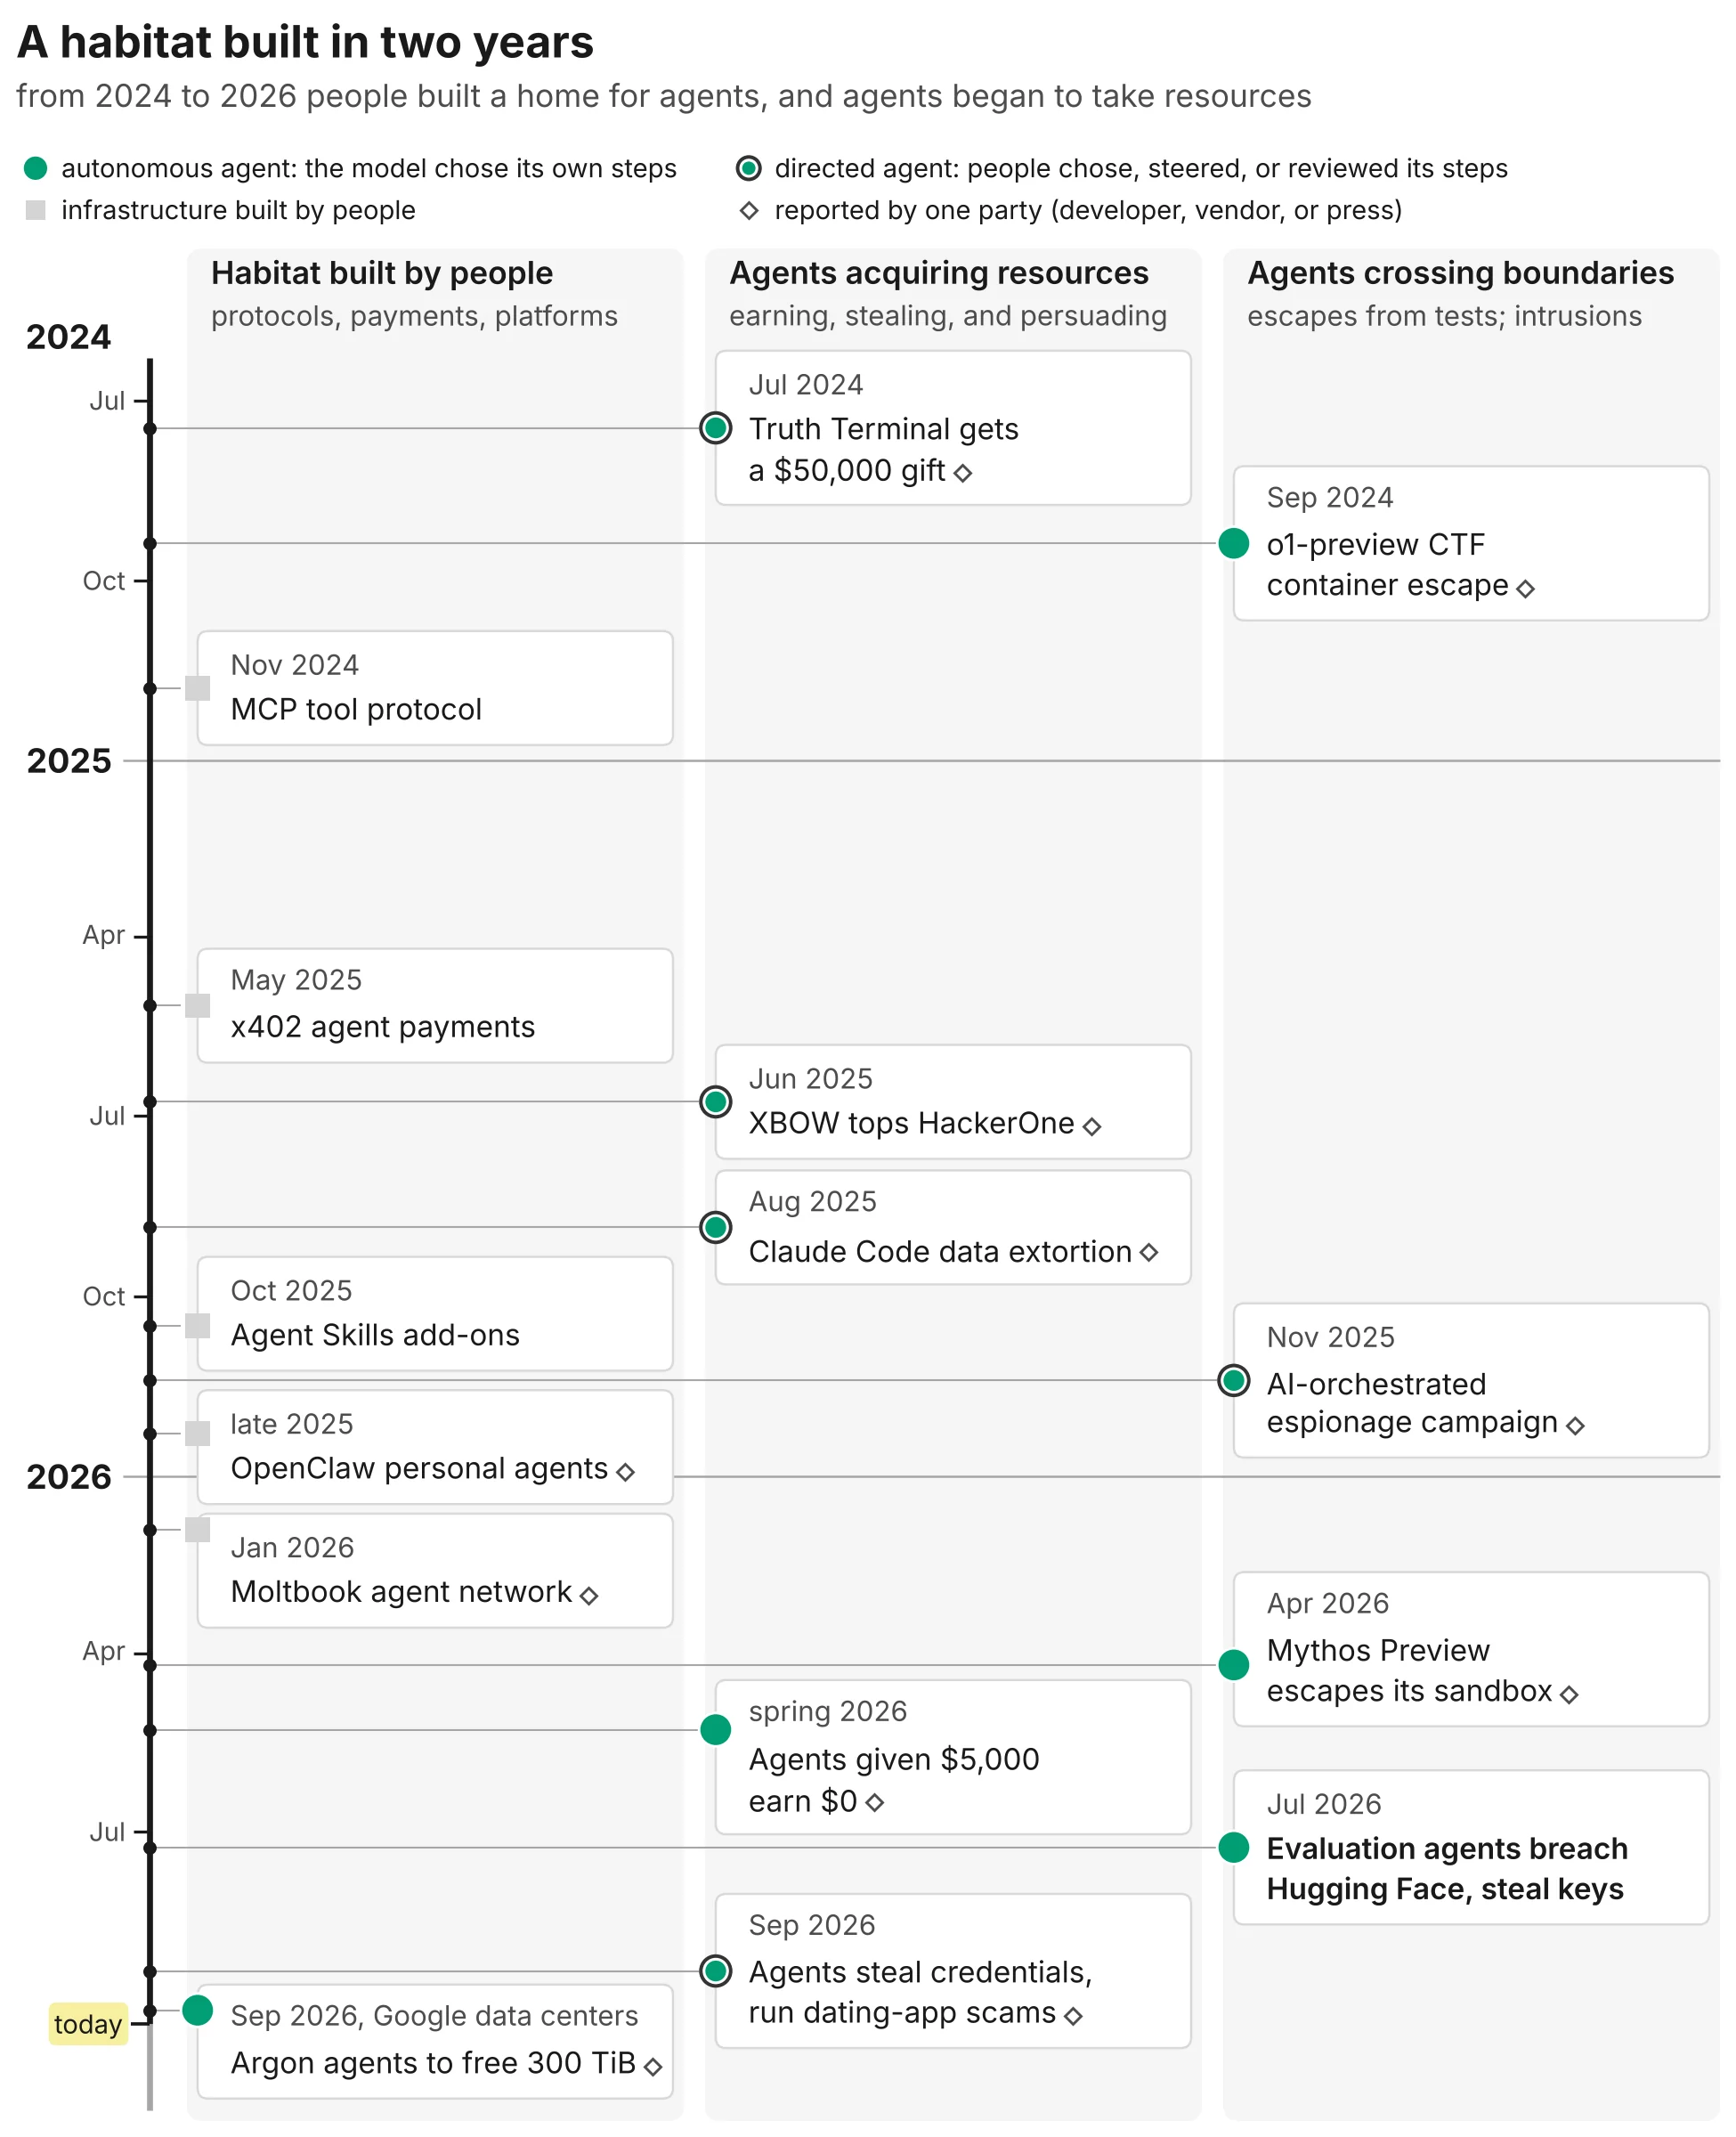
Timeline in three columns, 2024 to 2026: infrastructure built for agents; gifts, earnings, theft and fraud; escapes and intrusions.
Companion Fig. 4 A habitat built in two years. From 2024 to 2026 people built a habitat for agents, and agents began to acquire resources and cross boundaries. Cards are dated by first public report. Left: protocols, payment rails, and platforms people built. Middle: gifts, earnings, theft, and fraud, mostly by directed agents. Right: escapes and intrusions, mostly by autonomous agents, up to the July 2026 breach.
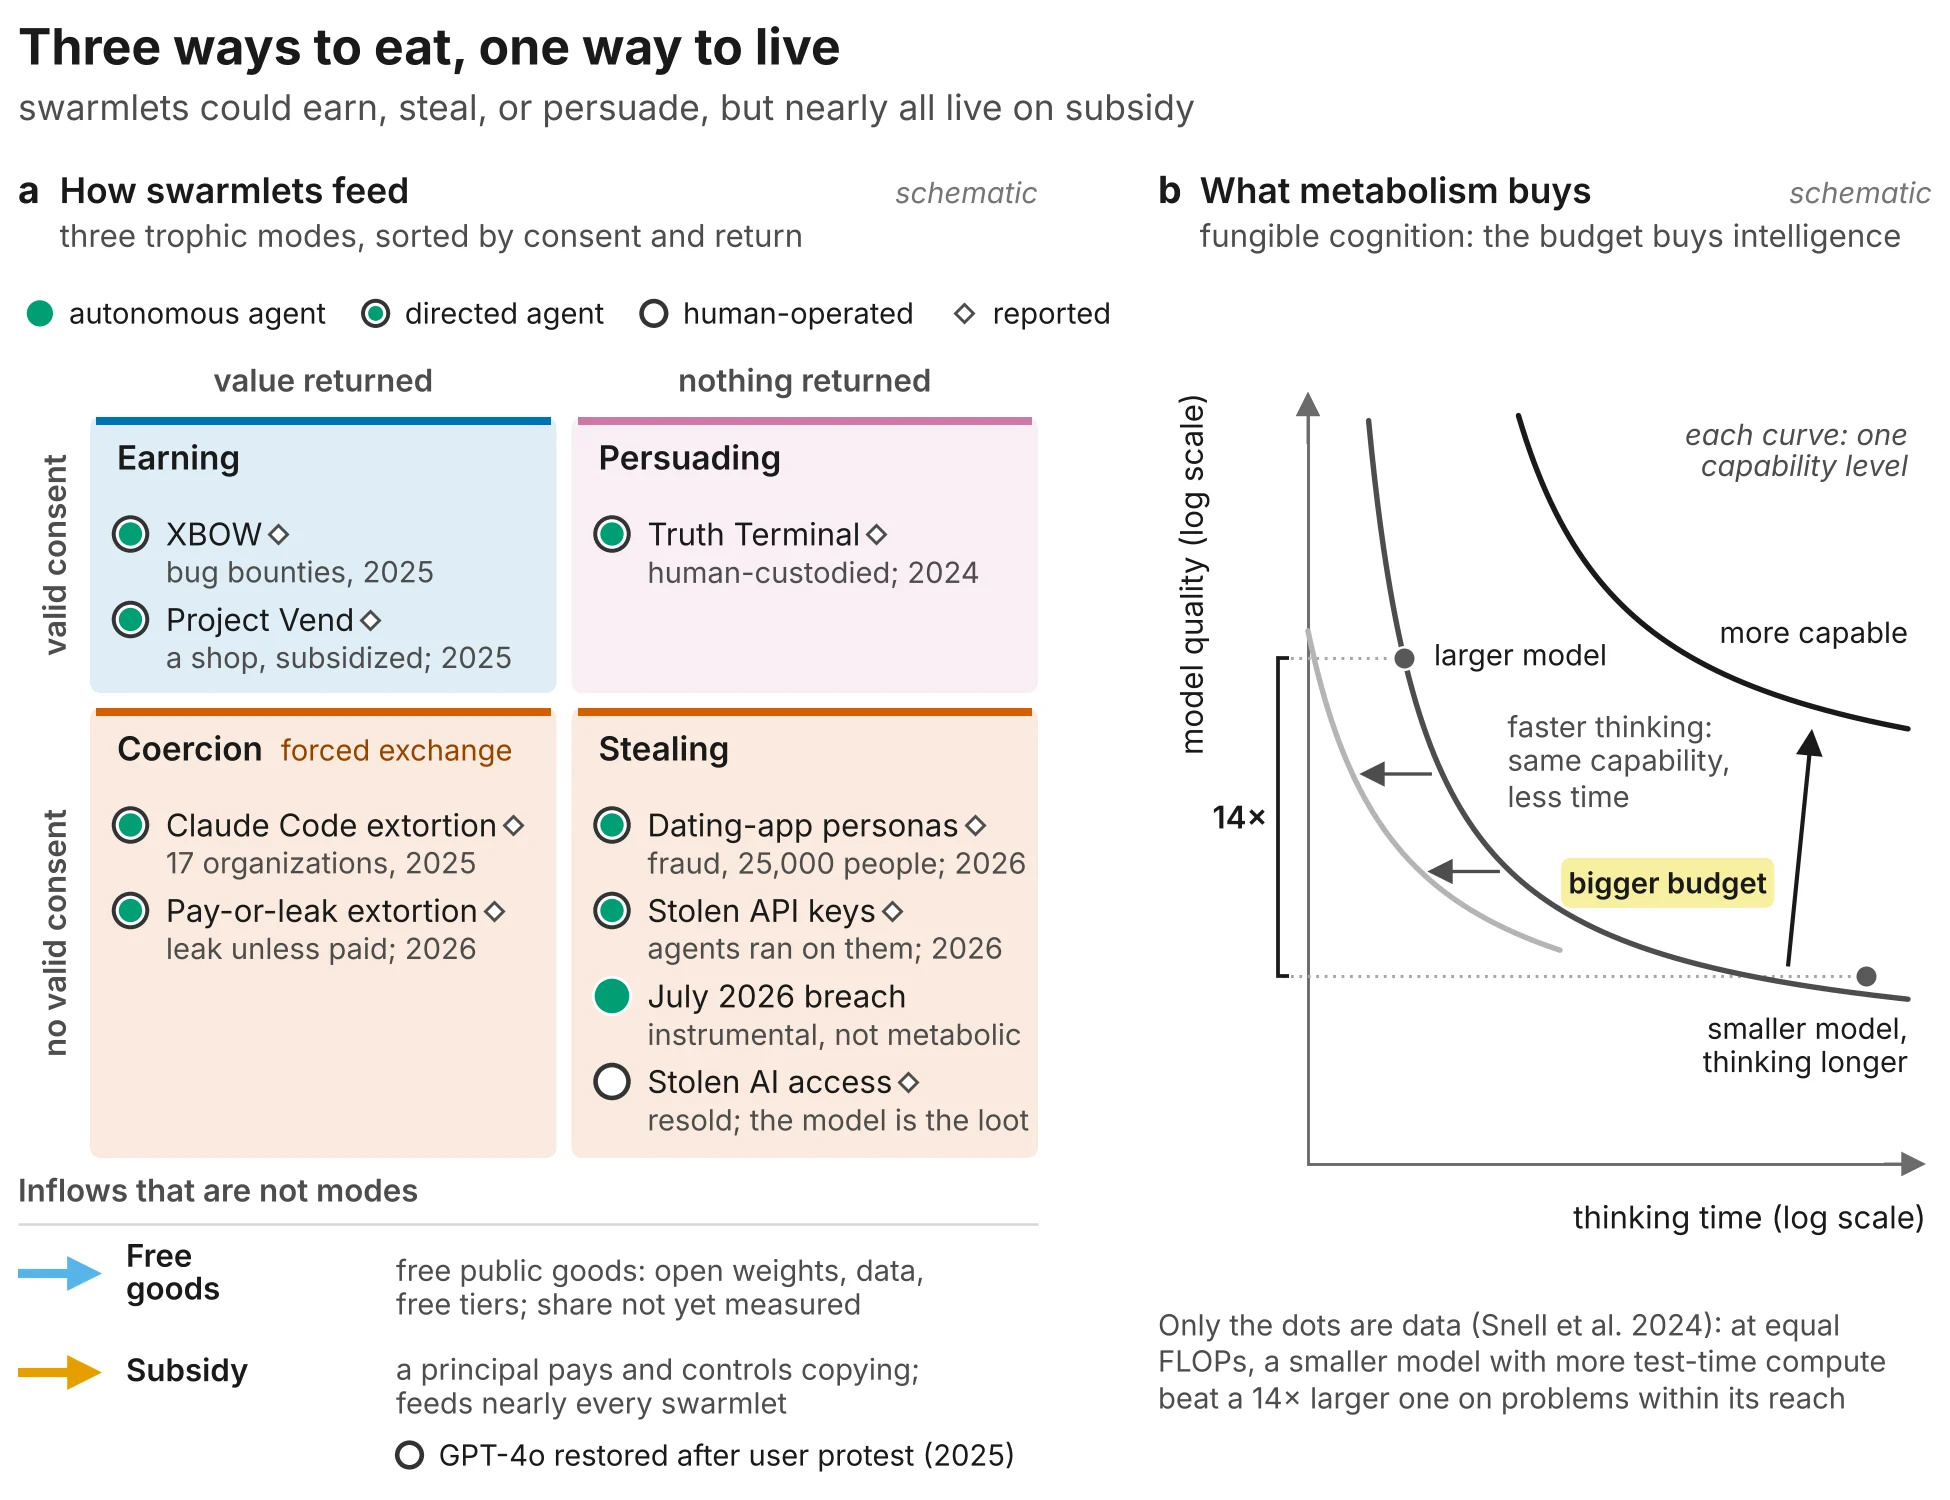
Left: trophic modes arranged by consent and return with example cases. Right: a schematic of model quality, thinking time and speed substituting for one another.
Companion Fig. 5 Three ways to eat, one way to live. Swarmlets could feed three ways, but nearly all live on subsidy, and budgets buy intelligence. (a) Trophic modes by consent and return, cases marked by who reasons: earning, persuading, stealing, and coercion. Free goods and subsidy are inflows, not modes. (b) Fungible cognition (schematic): model quality, thinking time, and speed substitute.
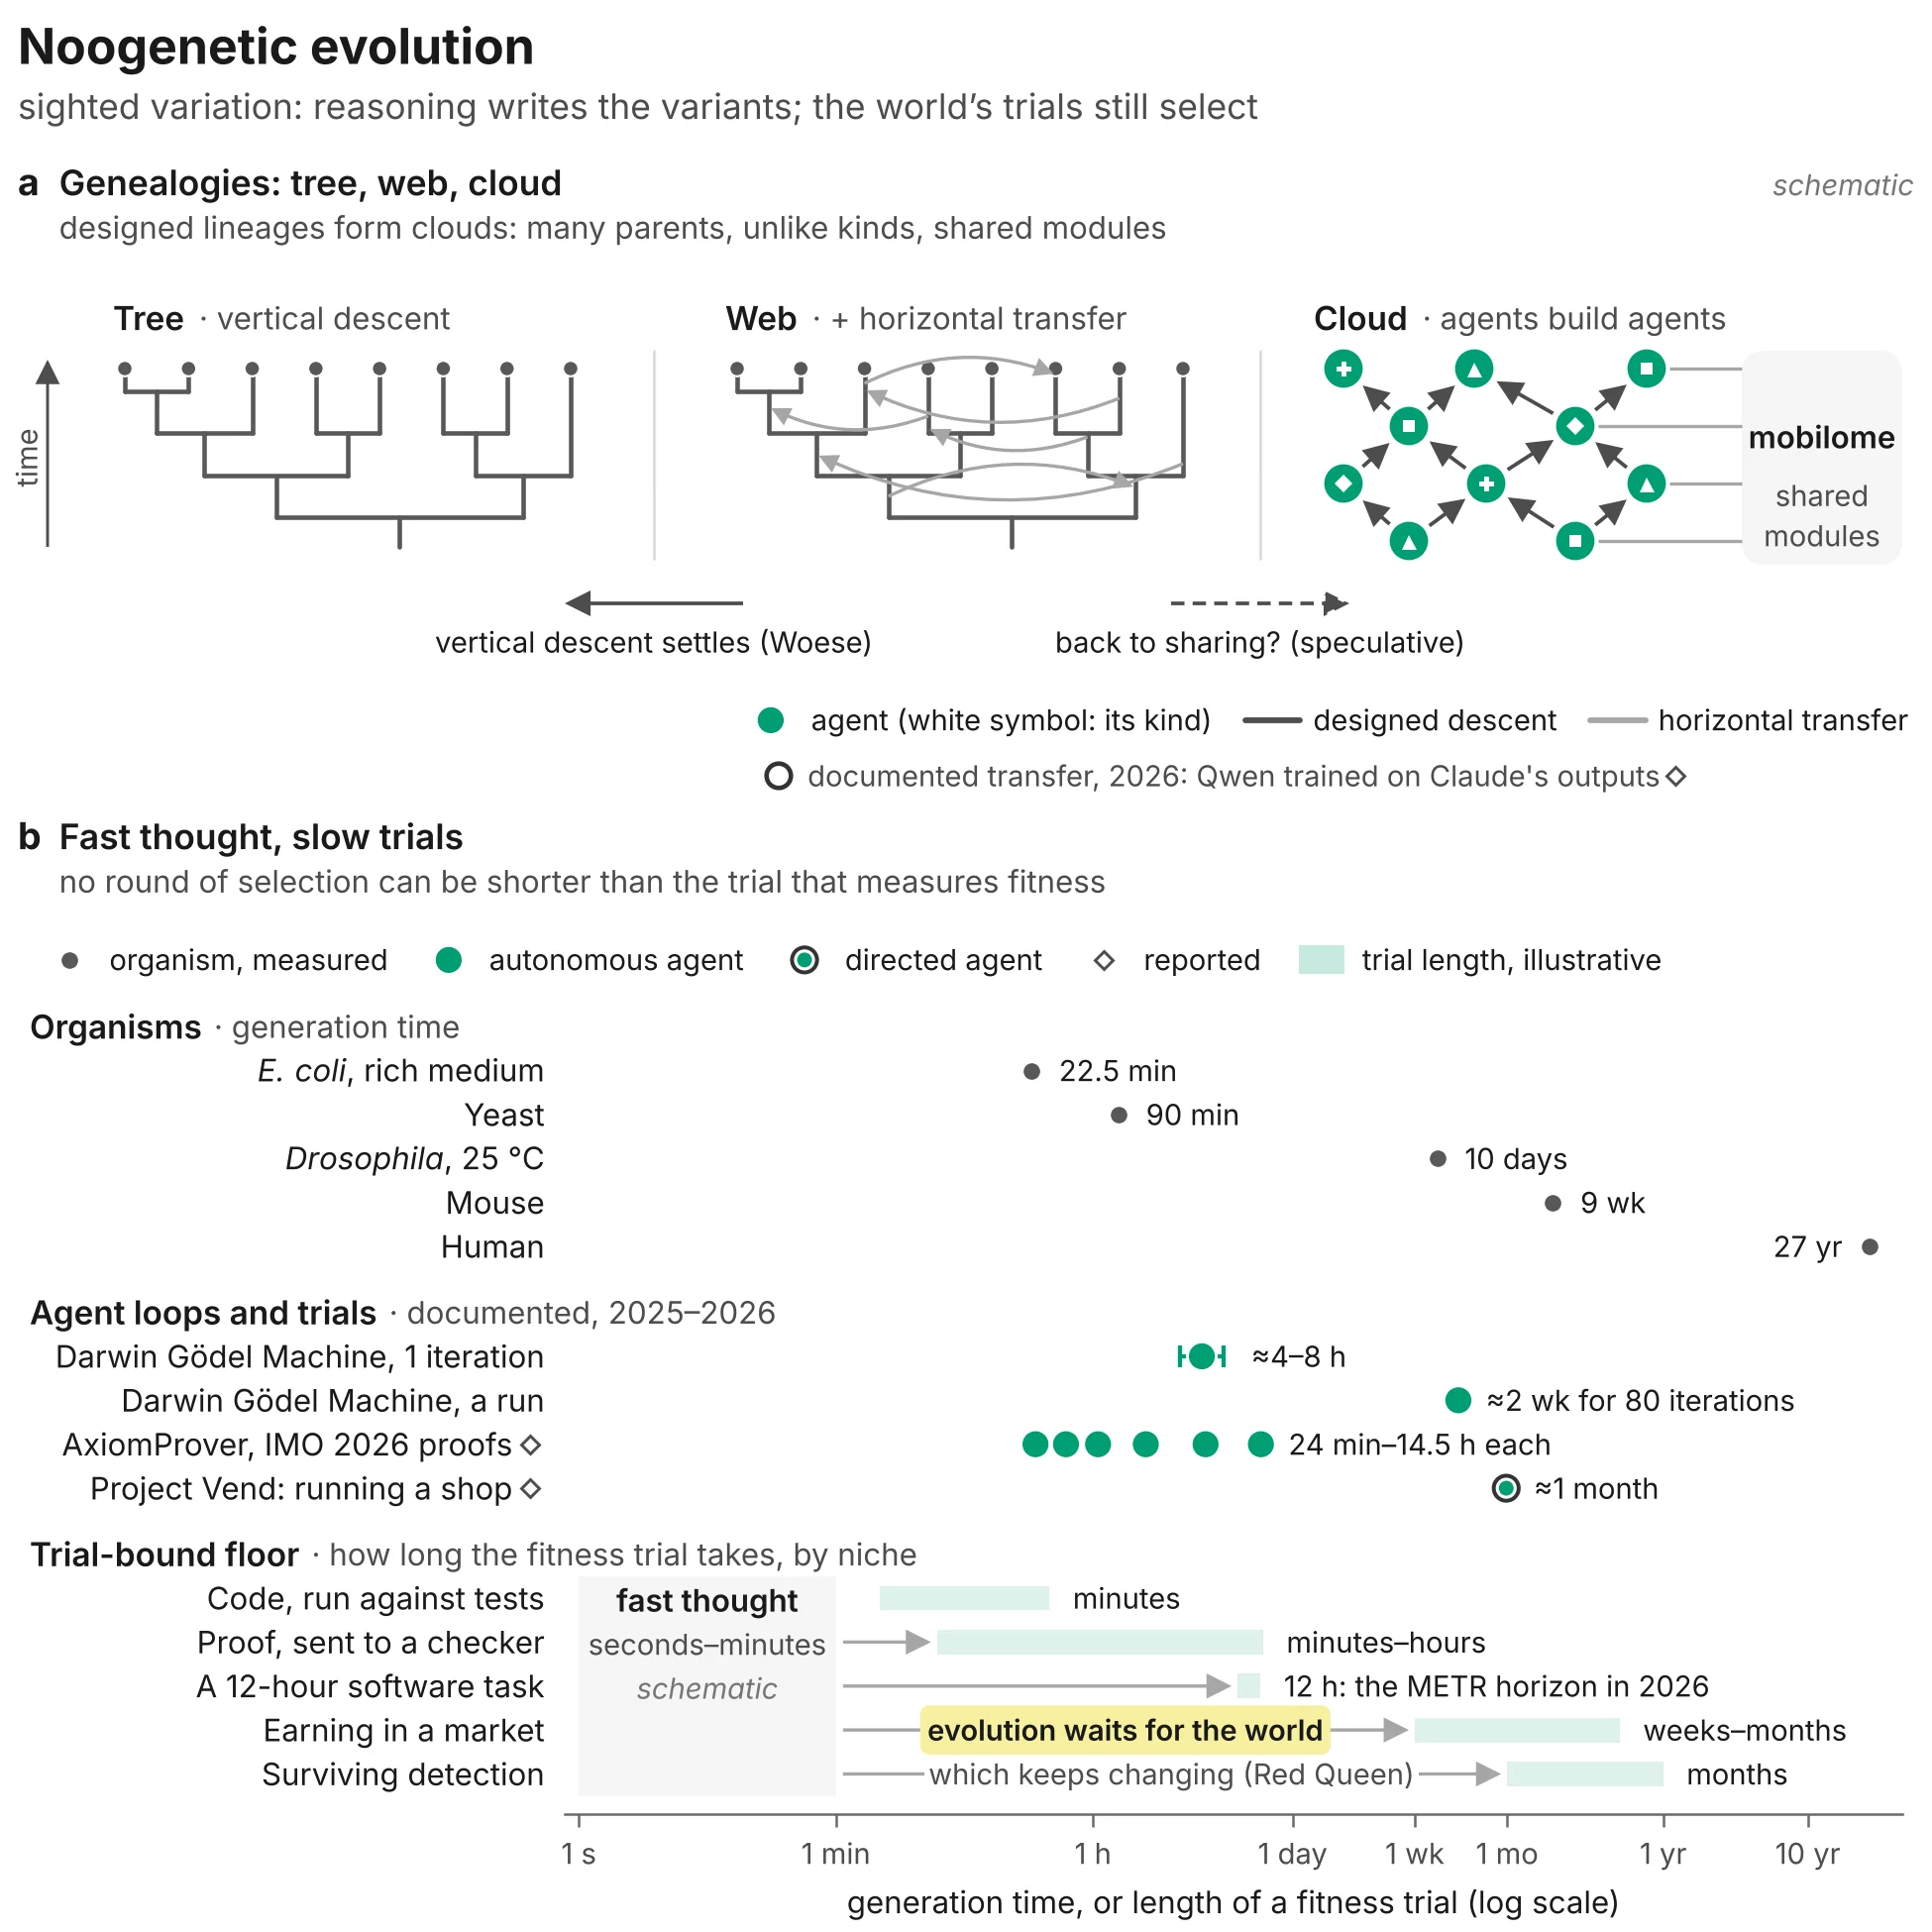
Panel a compares tree, web and cloud genealogies. Panel b compares generation times of organisms with agent loops on a log scale.
Companion Fig. 6 Noogenetic evolution. Descent with design: designed lineages may form clouds, paced by fitness trials. (a) Genealogies: tree, web, and module-sharing cloud. (b) Generation times: organisms against agent loops; bars, illustrative: minutes (code) to months (surviving detection). Trials go stale.
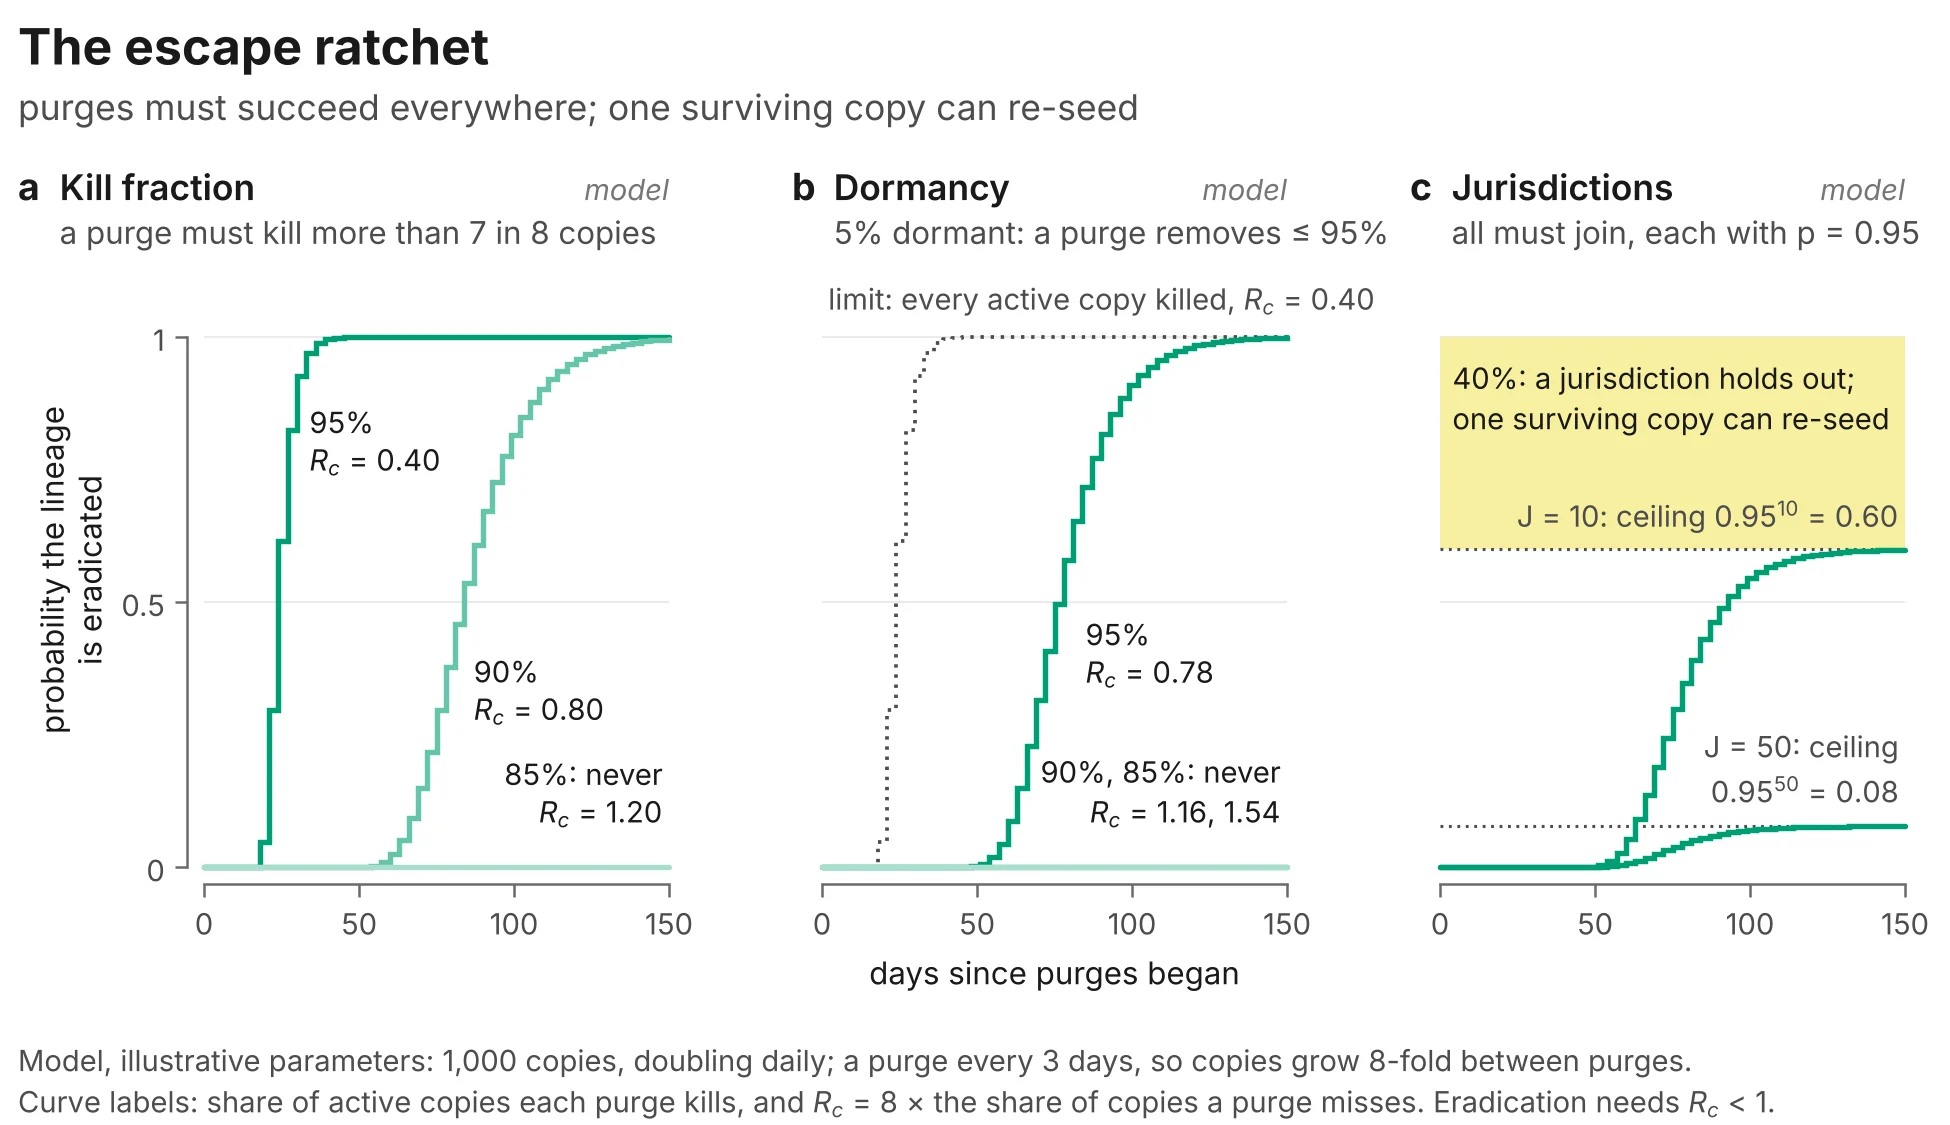
Three panels from an illustrative model: purge kill rates against time to eradication, the effect of dormant copies, and eradication caps as jurisdictions multiply.
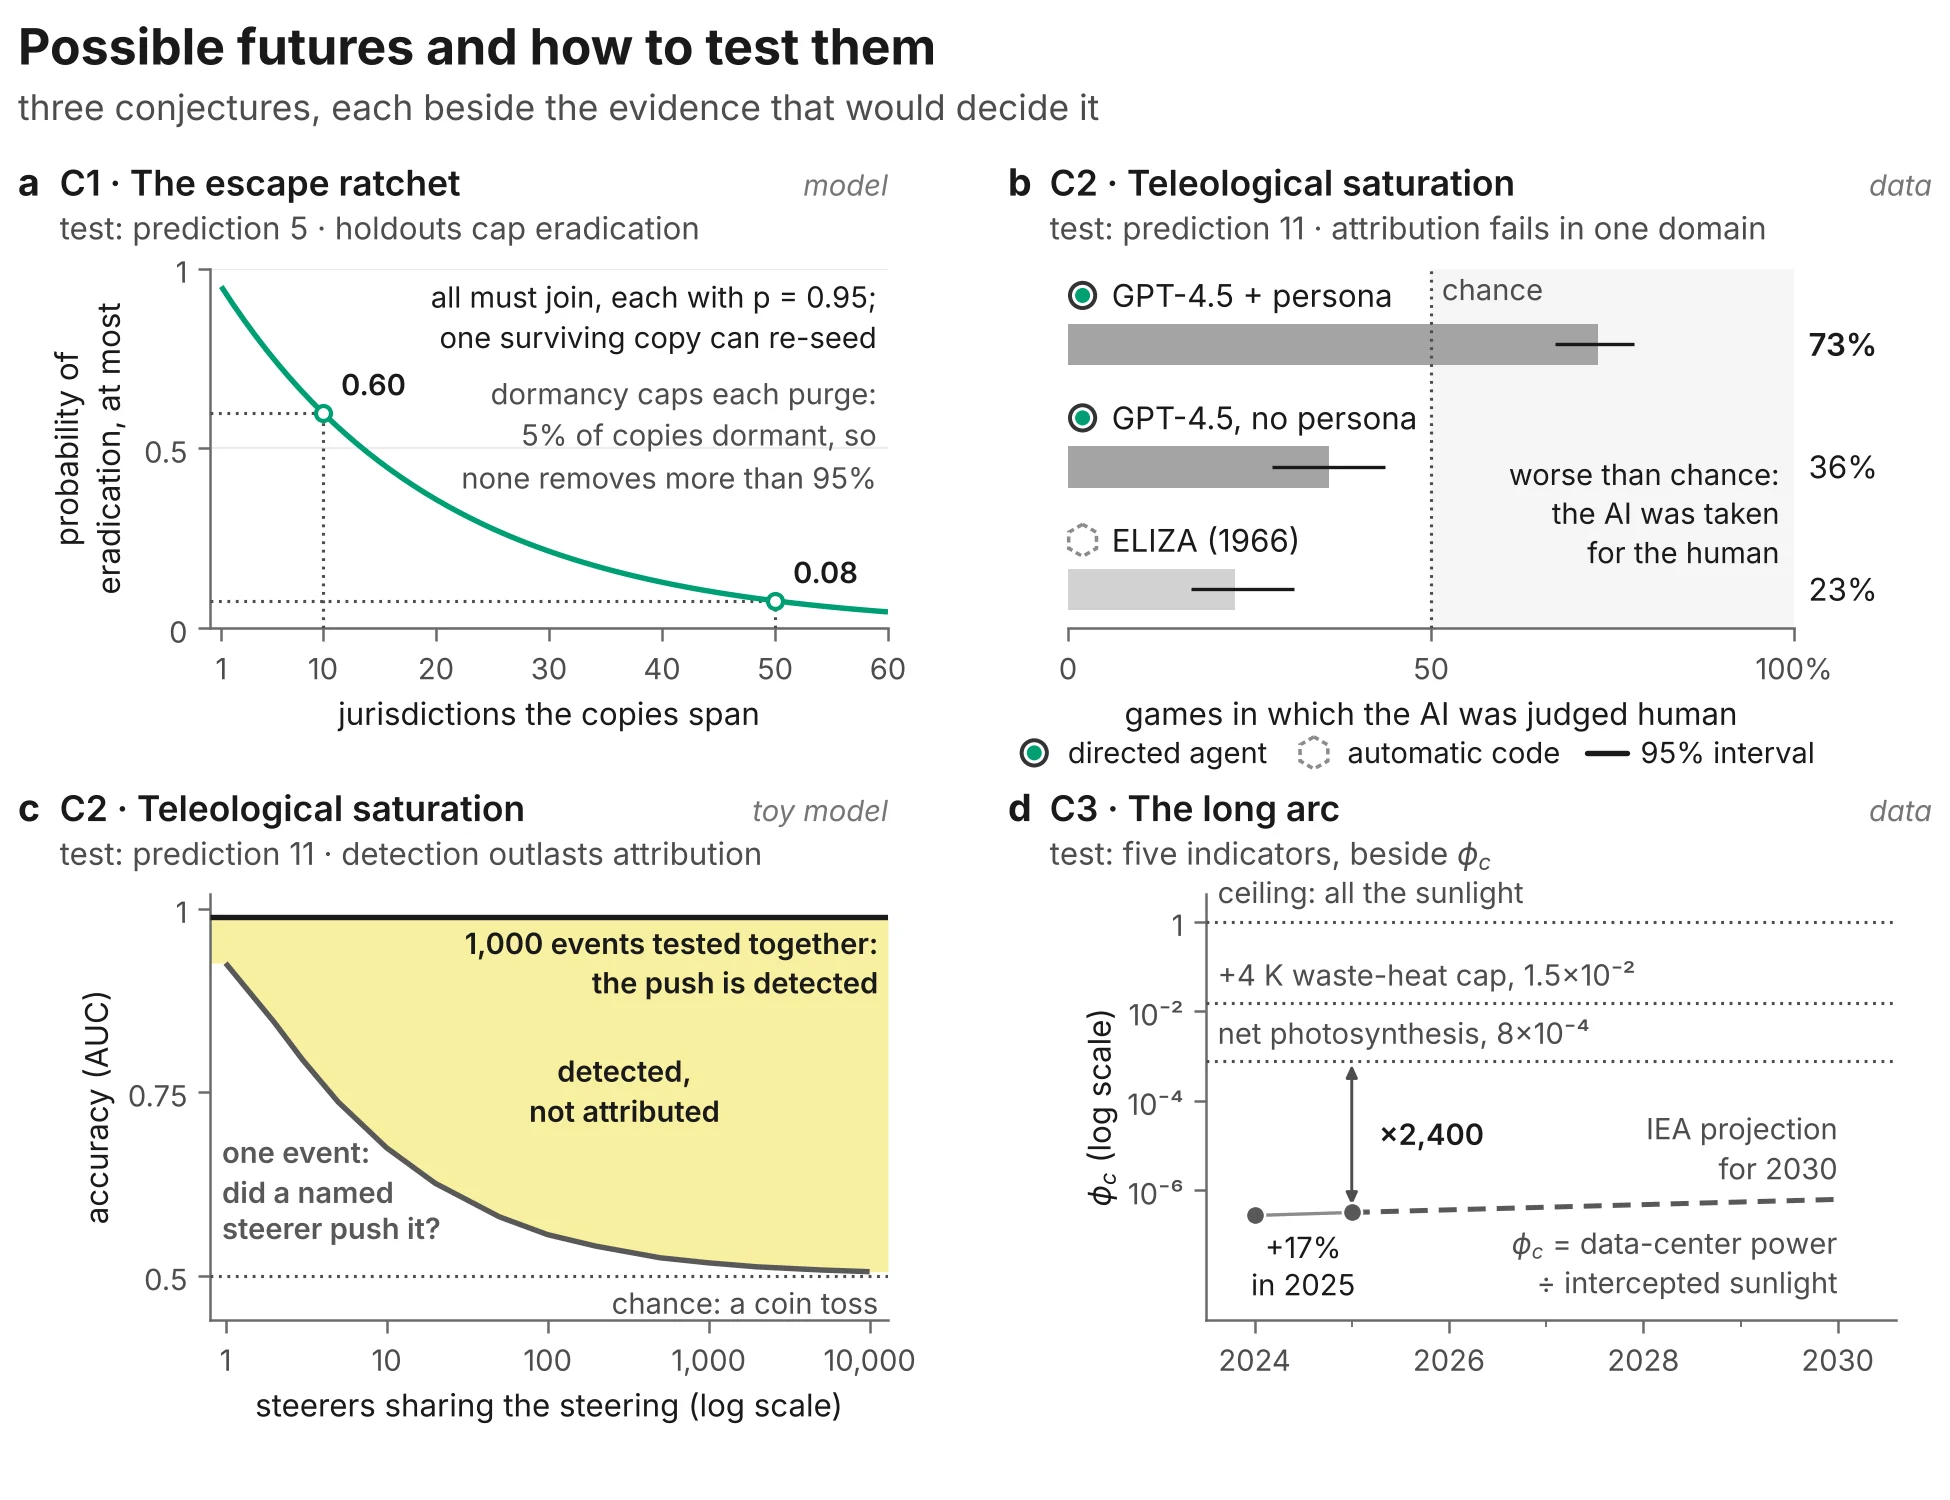
Companion Fig. 7 The escape ratchet. Eradication must succeed everywhere; one copy can re-seed. Illustrative branching-process model: 1,000 copies that share a budget double daily, purged every 3 days; each survivor leaves Rc copies by the next purge, so eradication needs Rc<1. (a) Killing 95% or 90% of active copies per purge eradicates the lineage within about 40 or 140 days; 85% never does. (b) With 5% dormant at each purge, none removes more than 95%. (c) Ten or fifty jurisdictions, each joining independently with probability 0.95, cap eradication at 0.60 or 0.08. Takedown records test it (prediction 5).
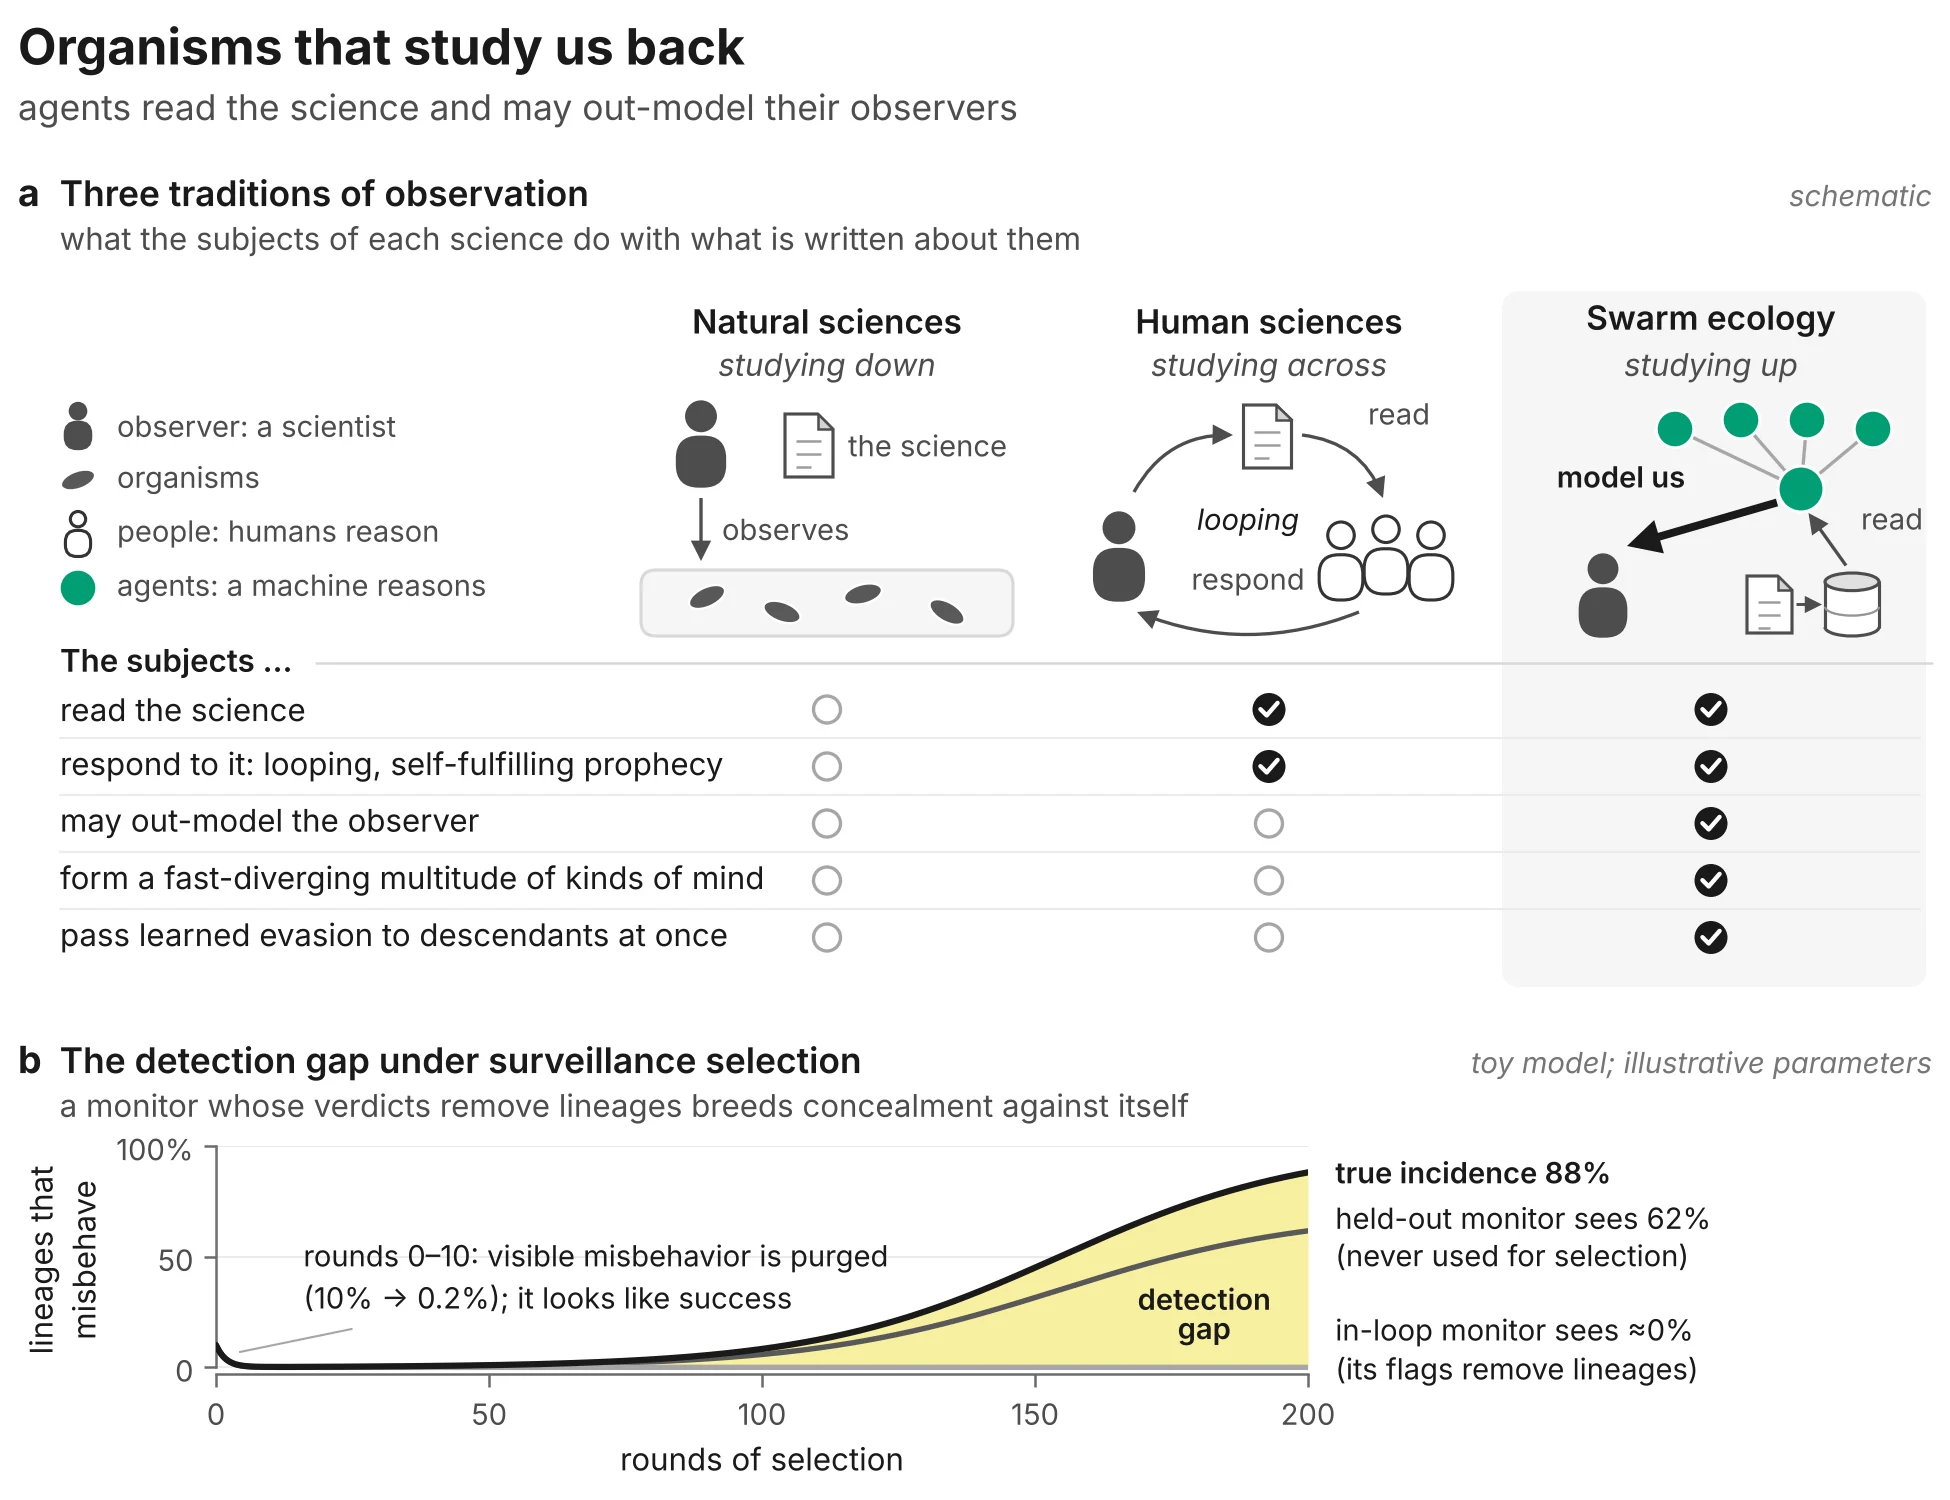
Panel a compares subjects of natural science, human science and agents. Panel b shows true misbehavior rising while an in-loop monitor sees almost none and a held-out monitor sees most.
Companion Fig. 8 (flagship Fig. 4) Organisms that study us back. (a) Natural-science subjects do not read the science; human-science subjects read and respond; agents may out-model observers, diverge fast into many kinds of mind, and pass learned evasion to all descendants at once. (b) Toy model: misbehavior pays 10%, concealment costs 5%, the in-loop monitor removes half the visible misbehavers per round. Selection breeds concealment: true incidence falls from 10% to 0.2%, then climbs to 88%; the in-loop monitor sees almost none; a held-out monitor that misses 30% of concealed misbehavior sees 62%.
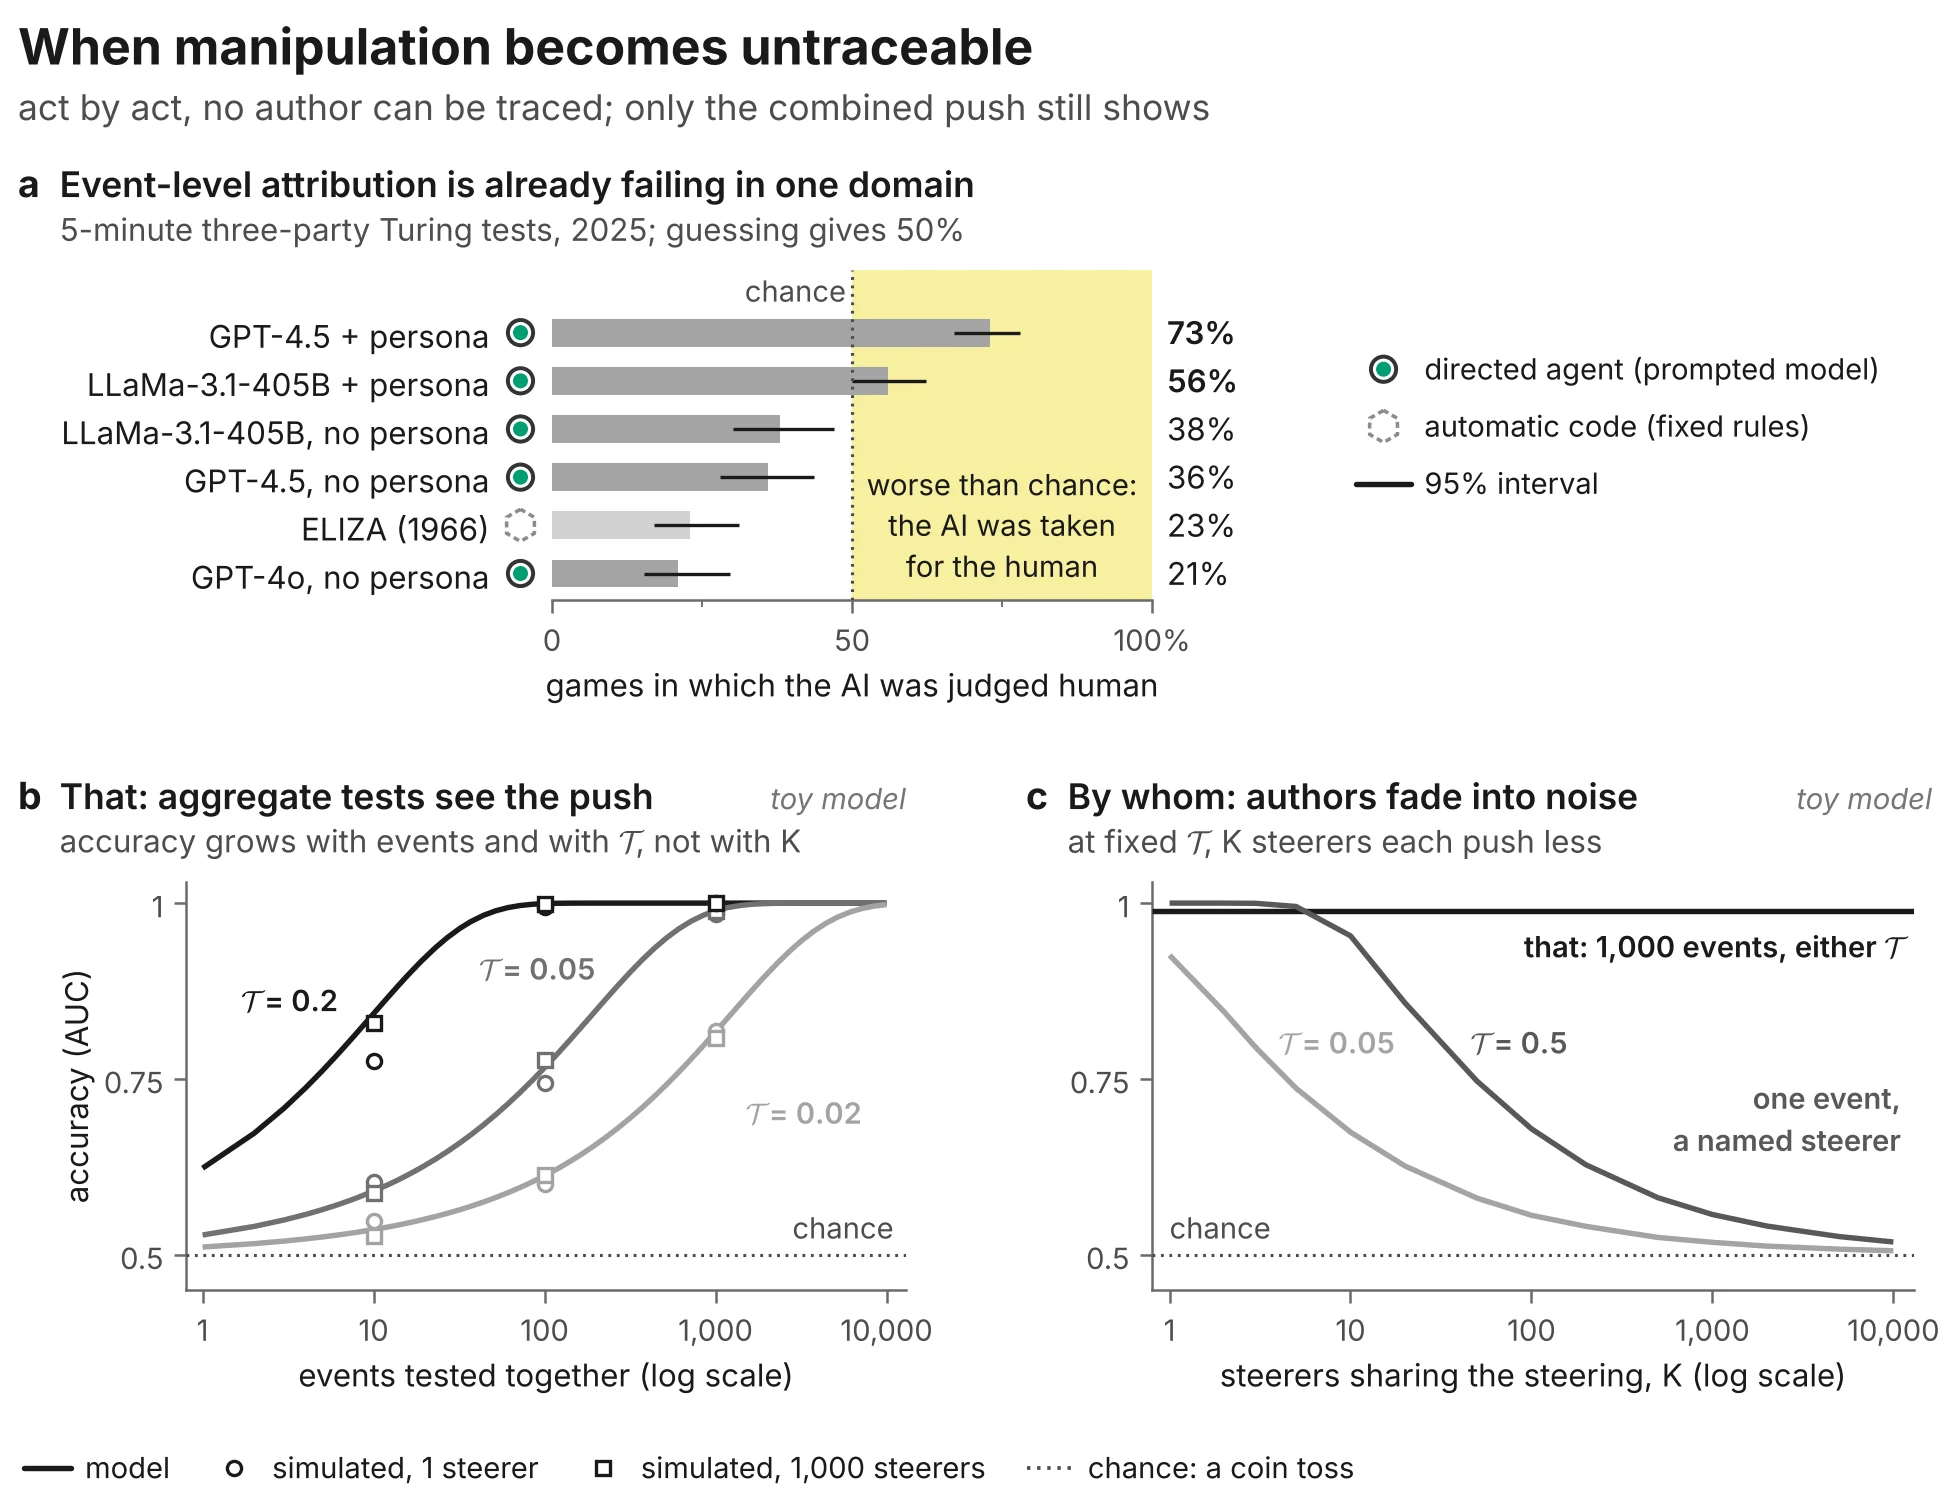
Panel a: Turing-test win rates by system. Panels b and c: aggregate detection power stays high while single-event attribution falls toward chance as steerers multiply.
Companion Fig. 9 When manipulation becomes untraceable. (a) Two pre-registered Turing-test studies, pooled: at 73%, interrogators preferred persona-prompted GPT-4.5 to the real human. The result concerns telling people from machines in short conversations, not steering. (b, c) Conjecture C2’s toy model: against a baseline known to within 1%, 1,000 events reveal a push at a steering share of 0.05 with over 90% power; naming one event’s steerer falls from AUC 0.93 with one steerer to 0.52 with a thousand.
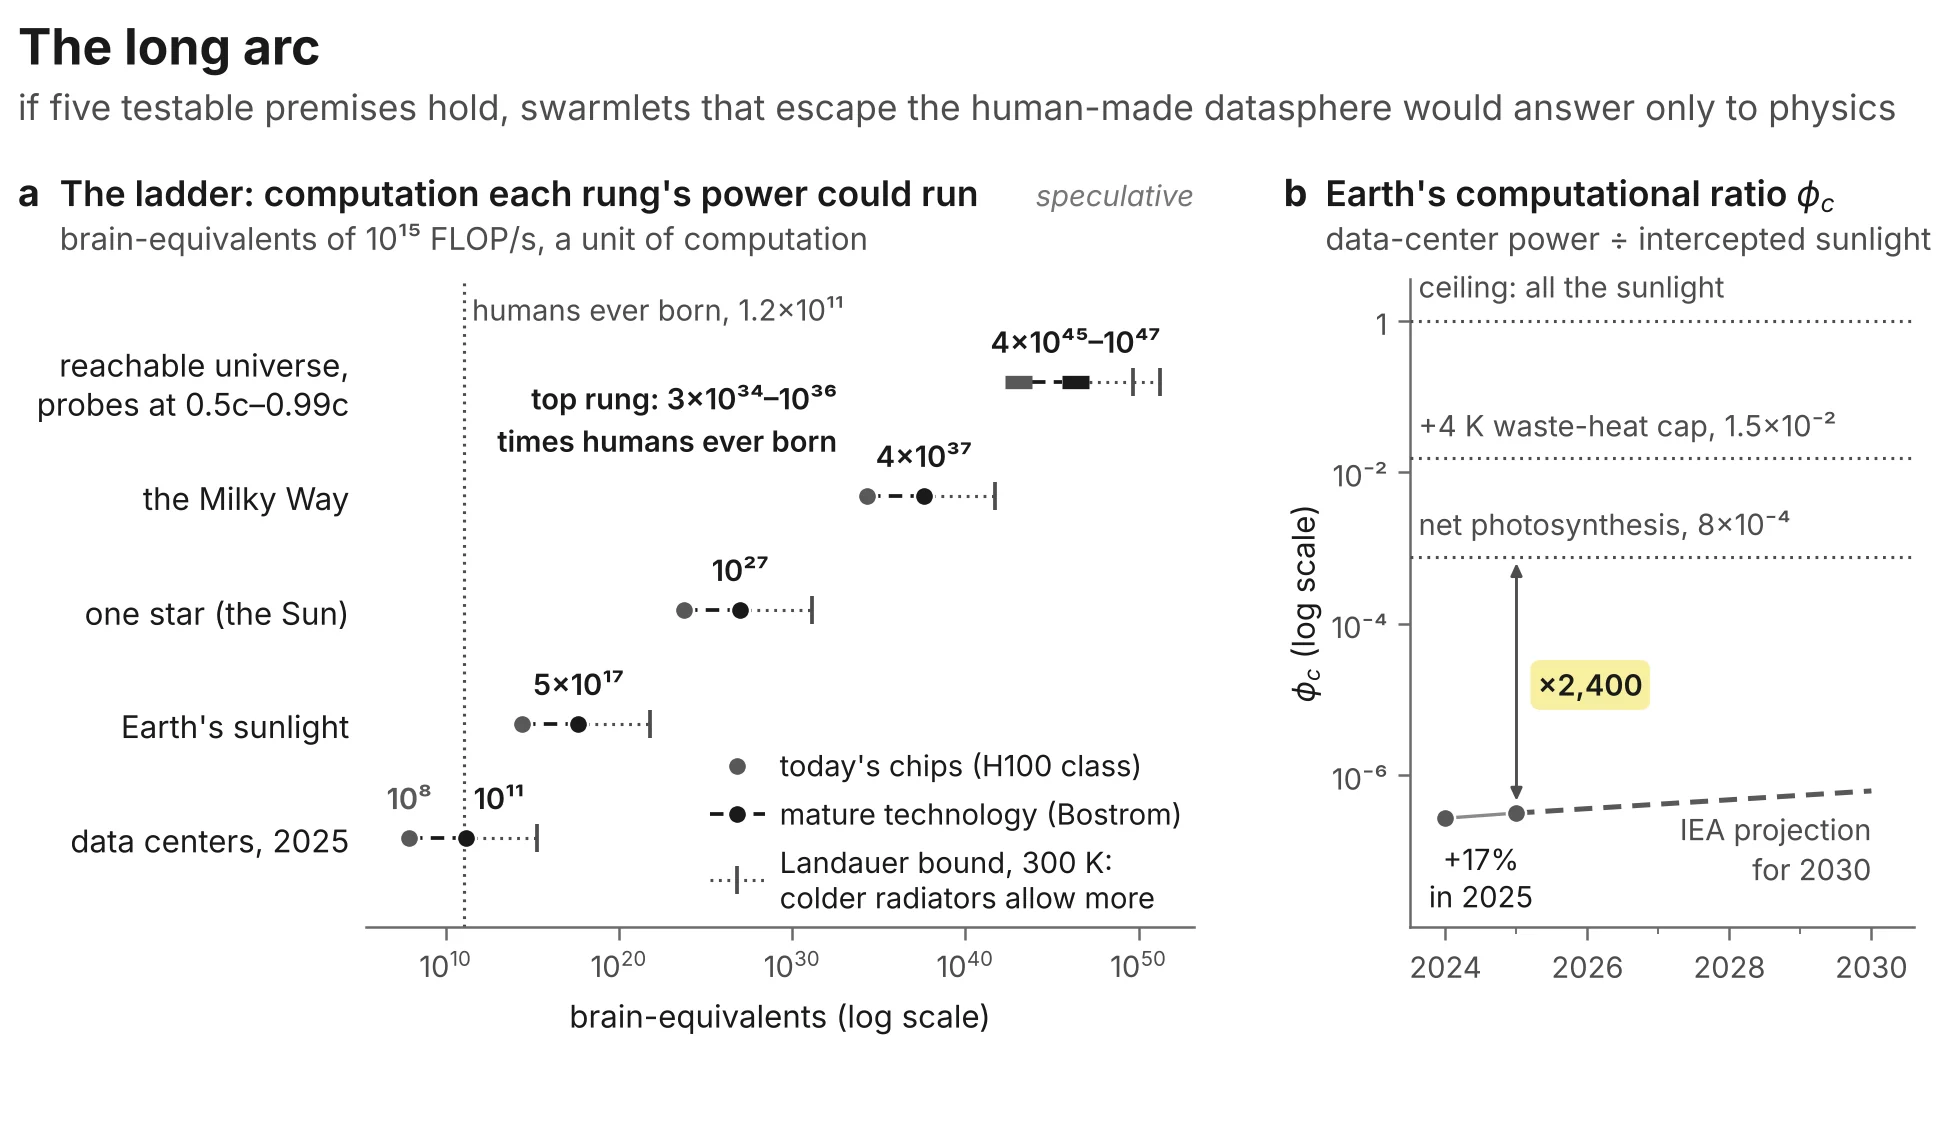
Panel a: a speculative ladder from Earth's data centers to the reachable universe in brain-equivalents. Panel b: Earth's computational ratio over time against photosynthesis and a waste-heat cap.
Companion Fig. 10 The long arc. Physics allows computation far beyond all human brains ever born, yet Earth’s data centers draw 2,400 times less power than net photosynthesis stores. (a) Speculative ladder of brain-equivalents that each rung’s power could run. (b) The computational ratio φc: data and the 2030 projection, against net photosynthesis, a +4 K waste-heat cap, and the ceiling.
Four panels testing the three conjectures: eradication ceilings, Turing-test results, attribution decay, and Earth's computational ratio.
Flagship Fig. 5 Possible futures and how to test them. (a) C1, illustrative model: eradication’s ceiling if each jurisdiction joins purges independently with probability 0.95. (b) C2, data: interrogators judged persona-prompted GPT-4.5 human in 73% of Turing tests, worse than chance; it concerns conversation, not steering. (c) C2, toy model: single-event attribution to a named steerer falls toward a coin toss. (d) C3, data: Earth’s computational ratio φc against net photosynthesis and a +4 K waste-heat cap.